


")
One of the things I do for a living is improve processes, and I do this using the scientific method. First, I make a change to a process, and then I use statistics to see whether or not the change makes a statistically significant difference. I keep the changes that make a positive difference, and I do not keep the changes that do not make a positive difference.
To look for statistically significant differences, I usually use control charts and process capability charts. Just for fun, I decided to use the same technique to see if our economy does better under Republican, or Democrat, leadership. I would like to share my findings.
Here is our first control chart, showing the unemployment rate by President.
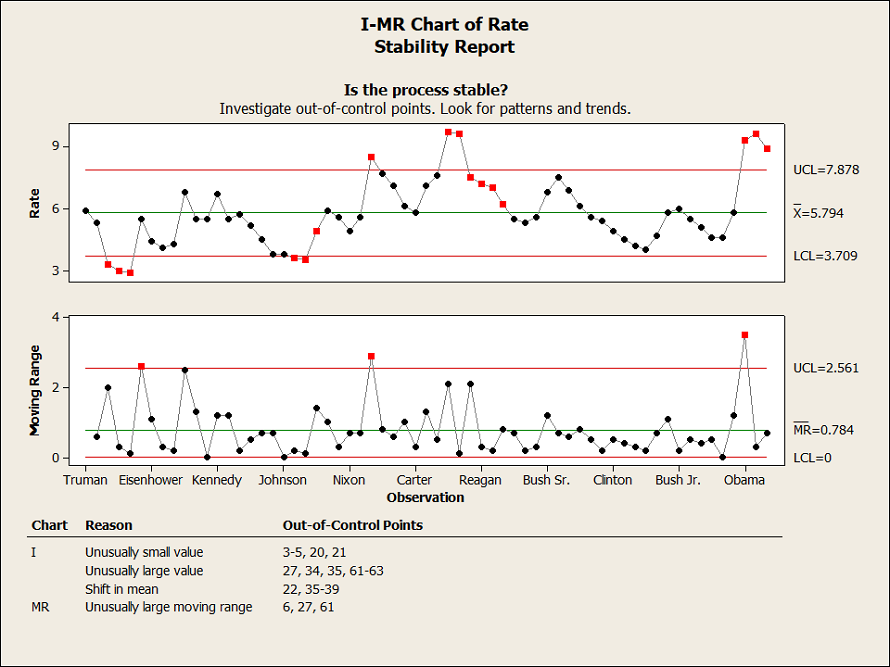
The control chart actually has two sections. The top chart is our list of data points – in our case, the average unemployment rate by year. The bottom chart shows the amount of change from year to year. The green line shows the average, or mean unemployment rate, for the entire chart, and then we have upper and lower control levels in red, three standard deviations from the average. In statistical parlance, that means that virtually every data point should fall between the control limits, if the data is random, and we assume that the data is random if it falls between the control limits. Data points in red show something that cannot be attributed to random variation.
We use primarily the top chart. On the bottom chart, we are looking for statistically significant variation in how much the data points change from point to point.
We can see that under Truman and Eisenhower, and under Johnson and Nixon, the unemployment rate was below the lower control limit, showing a statistically significant low unemployment rate. We can also see that under Johnson and then Nixon, there were nine data points in a row below the average. That too shows a statistically significant difference in the unemployment rate. We would call these things positive, as they show statistically significant low rates of unemployment.
We can also see that under Nixon, Carter, Reagan, and Obama we had statistically significant high rates of unemployment. We also see a statistically significant change in the unemployment rate occurring when Eisenhower took office, in the middle of Nixon’s presidency, and when Obama took office.
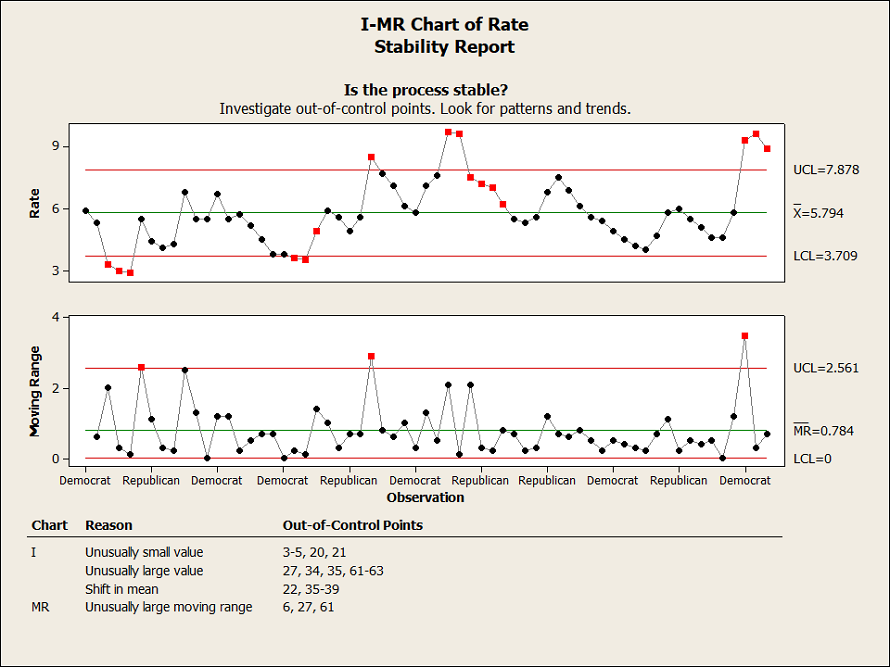
Overall, we might say that individual Presidents did a better or worse job than others in statistically significant ways, but the party in power does not seem to make a difference. Just to be sure, the next control chart (to the left) looks at the same data, but shows the party in power rather than the specific President.
While we do see statistically significant events, they occur, both in terms of good and bad unemployment rates, somewhat evenly between parties.
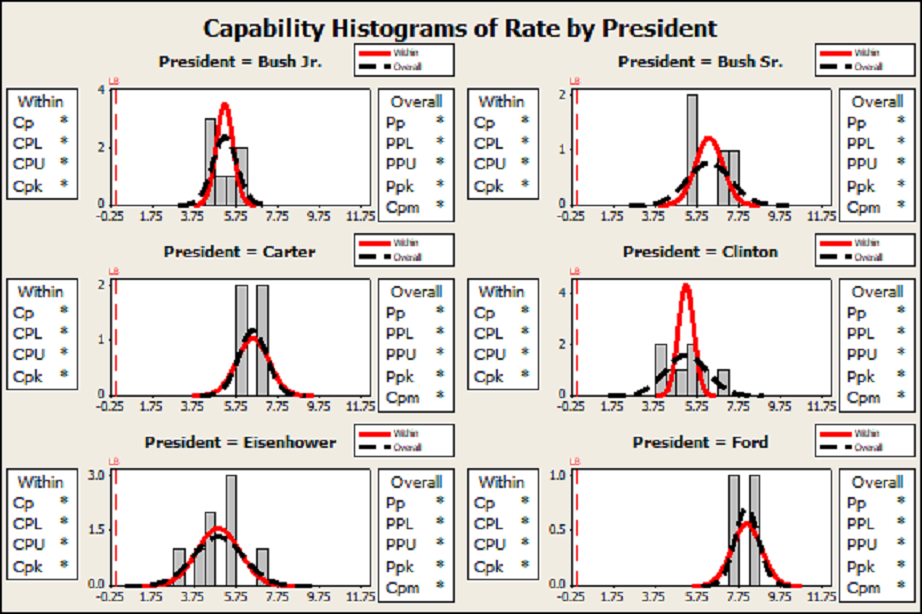
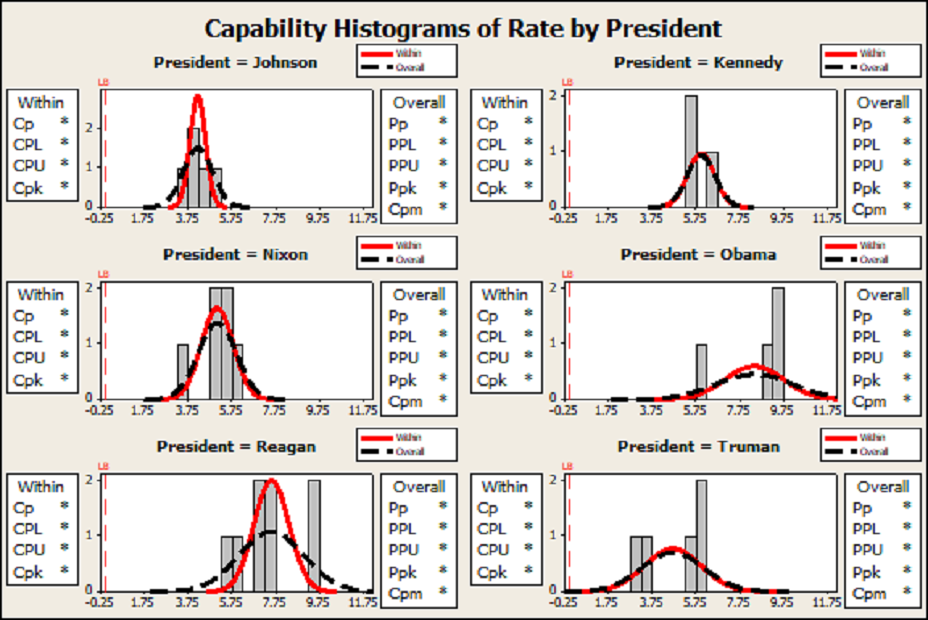
The next two charts (below) show the level of variation and the capability bell curves for each President. This shows us what the economy was capable of delivering, in terms of unemployment rates, under each President. If the bell curves are narrow, that means there was a narrow range of variability during that President’s tenure. If it is very wide, that means the unemployment rate varied a great deal under that President. We can also see what the average unemployment rate was for each President. Under these two charts, I show the overall picture for Republican and Democrat presidents.
We see a great deal of difference between the different Presidents, but it again appears to be unrelated to the party the President belongs in.
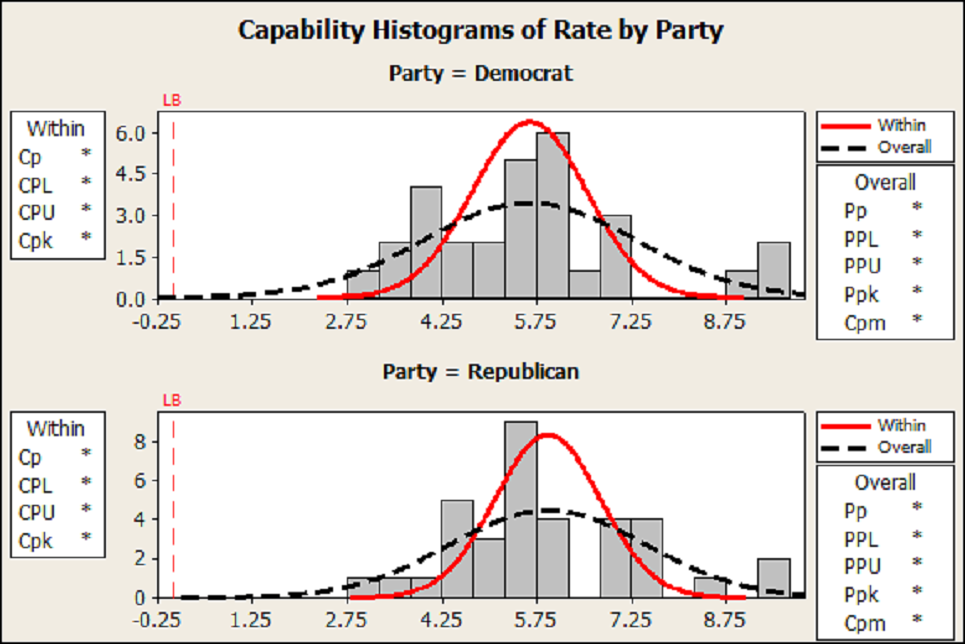
The next graph (left) shows the same data, lumping all Democrat and Republican presidents together. You’ll notice that it makes absolutely no difference whether the President is a Democrat or a Republican. Both the levels of unemployment, and the amount of variability in the levels of unemployment, are almost exactly the same, with not statistically significant difference at all.
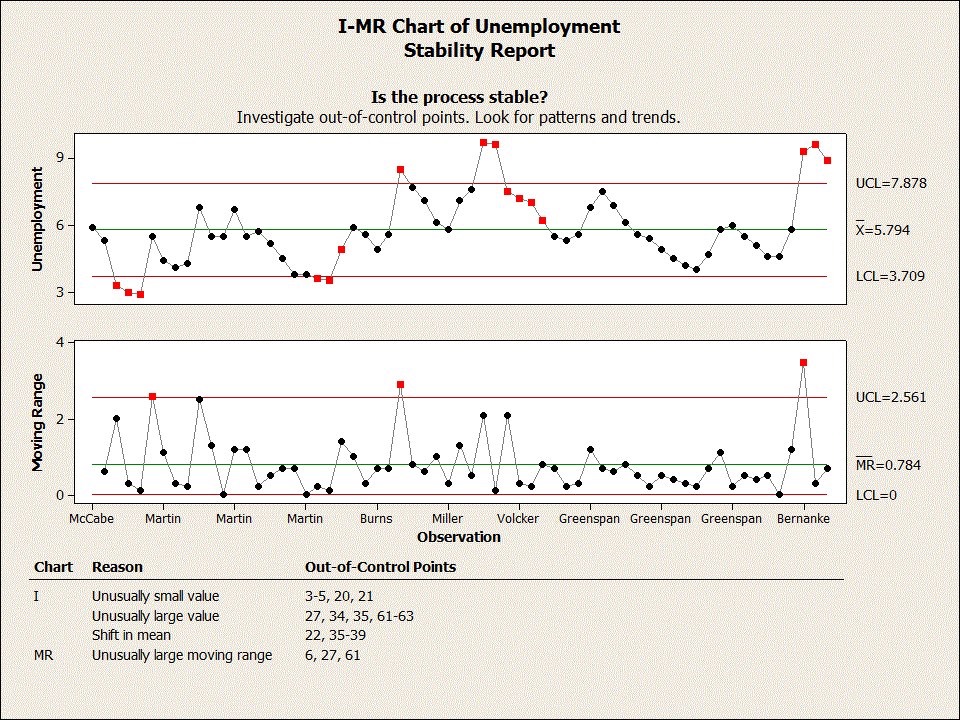
I added another control chart (below), showing the unemployment rate for each Federal Reserve Chairman. Interestingly, we do see statistically significant changes based on who runs the Federal Reserve.
McCabe was outstanding. Martin was average. Burns stunk. Miller caused a bad recession that Volker fixed. Greenspan was average, and Bernanke was the worst fed chairman in recent history.
I did a little more analysis on who was in charge of Congress at different times, vs. the party holding the Presidency, and I found that this made almost as big a difference as did the Federal Reserve Chairman. In a nutshell, the economy does poorly whenever either party is in charge of both Congress and the Presidency, and the economy does well whenever we have gridlock. This should not be surprising to a libertarian, as it means that both political parties generally do a poor job running the economy, but that the economy generally does well when government does nothing.
What is the takeaway from all of this? Simple. Our government is terribly, terribly ineffective, and the vast majority of the things it does make things worse rather than better. Also, the Federal Reserve has more to do with how the economy runs than does our government – essentially making the Federal Reserve Chairperson as important or more important than all of government combined, at least in terms of the economy. It also means that our economy does much better when we have stable rules than when we have changes in the rules.
Government generally adds regulations rather than removing them, so these charts cannot tell us whether or not free markets work better than controlled ones, but we can infer (from the fact that adding regulations consistently harms the economy) that regulations, in general, are bad for the economy. From this we can further infer that free markets work better than highly regulated ones. We can also look to the rates of growth in the US economy (and in living and working conditions for US workers) in different time periods of our nation’s history. During the period of 1789-1913, when we had an almost unbridled free market economy, we also had the fastest rate of growth of any country at any time in world history. From 1913 onward, the rate of growth has slowed, rebounding only briefly after World War Two, as the rest of the world rebuilt from the war. This was of course unsustainable, ending as Japan and Europe began to compete again.
The takeaways are 1) that politics is a rat race to the bottom, with both political parties doing great harm to our country, 2) that the Federal Reserve has far too much power over the economy, and 3) that we need to remove as many regulations, and as much government control over the economy, as humanly possible.
NOTE: This article was originally published to The Daily Libertarian on September 6, 2017. The data does not include Trump’s Presidency.


Non-economists tend to overlook the lag effect in economic results. The lag effect is the time it takes from when a policy/regulation is enacted to when the actual results occur. On a macroeconomic scale, the lag effect of any given policy may be as short as a couple of months to a couple of years. Assigning credit or blame for a given policy is difficult given the lag effect. In politics, the politicians either take credit if the current economy is positive even if they themselves did nothing legislatively (Bill Clinton comes to mind) and they also blame their predecessor if the economy is not doing well. In Trump’s case, the economy shot up when he overturned most of Obama’s executive orders and legislation. The irony is many on the Democrat side trying to take credit for the Trump economy saying Obama caused the economic growth despite that clearly documented fact.
This article does not ignore the lag effect, but I do recognize that you cannot objectively take the lag effect into account when doing such an analysis. All policies have short, medium, and long term effects, and it is entirely possible that effects will occur under a different President, as we move from the short to the long term. This analysis does assume that effects occurring under future Presidents are somewhat randomly distributed. Any other assumption would add subjectivity to the analysis.
Fax nigga